Monitoring Energy Consumption on Embedded Platforms
My name is Ashley Whetter, I’m a second year computer science student at Bristol University and I’m working on the energy measurement hardware infrastructure.
How will an “energy measurement hardware infrastructure” be used?
As a machine learner, the MAGEEC plugin needs initial training data so that it has an idea of what optimizations will result in a more energy efficient program, given a set of program features.
Using embedded platforms and custom energy monitoring hardware we can accurately measure the amount of energy that a program uses. By automating the loading, running, and measuring of a set of benchmarks, we can easily collect a set of training data for the MAGEEC plugin.
Later on in the project this infrastructure can also be used to test the compiler across a wide range of benchmarks, both in terms of energy efficiency improvements and program correctness.
Hardware
Currently the infrastructure consists of two different ARM boards and an energy monitoring board.
ARM Boards
The first ARM board is an STM32VLDISCOVERY and this runs the benchmarks. It’s a bare metal board with an ARM Cortex M3 processor and 8KB of RAM.
“Bare metal” meaning that the board has no operating system and this is key to producing accurate energy consumption measurements. An operating system could affect results by consuming energy for it’s own computations, as well as scheduling the program to run at different times each time the program is run.
The next ARM board is an STM32F4DISCOVERY, and this runs the energy monitoring software and is responsible for taking the readings from the energy monitoring board and outputting it via USB.
The F4 board is more powerful than the VL and has an ARM Cortex M4 processor and 192KB of RAM. The important components on this board are it’s 3x ADCs (Analogue to Digital Converters). They form a vital part of the energy monitoring circuitry, and multiple ADCs means we can get energy reading from multiple external boards. But too many external boards and the USB becomes a bottleneck! For this reason, we’re currently using just one VL board per F4 board.
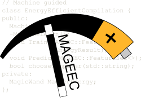
Energy Monitoring Boards
There are two different energy monitoring boards.
The first, which we are using currently, was designed by Bristol University for the EACOP project.
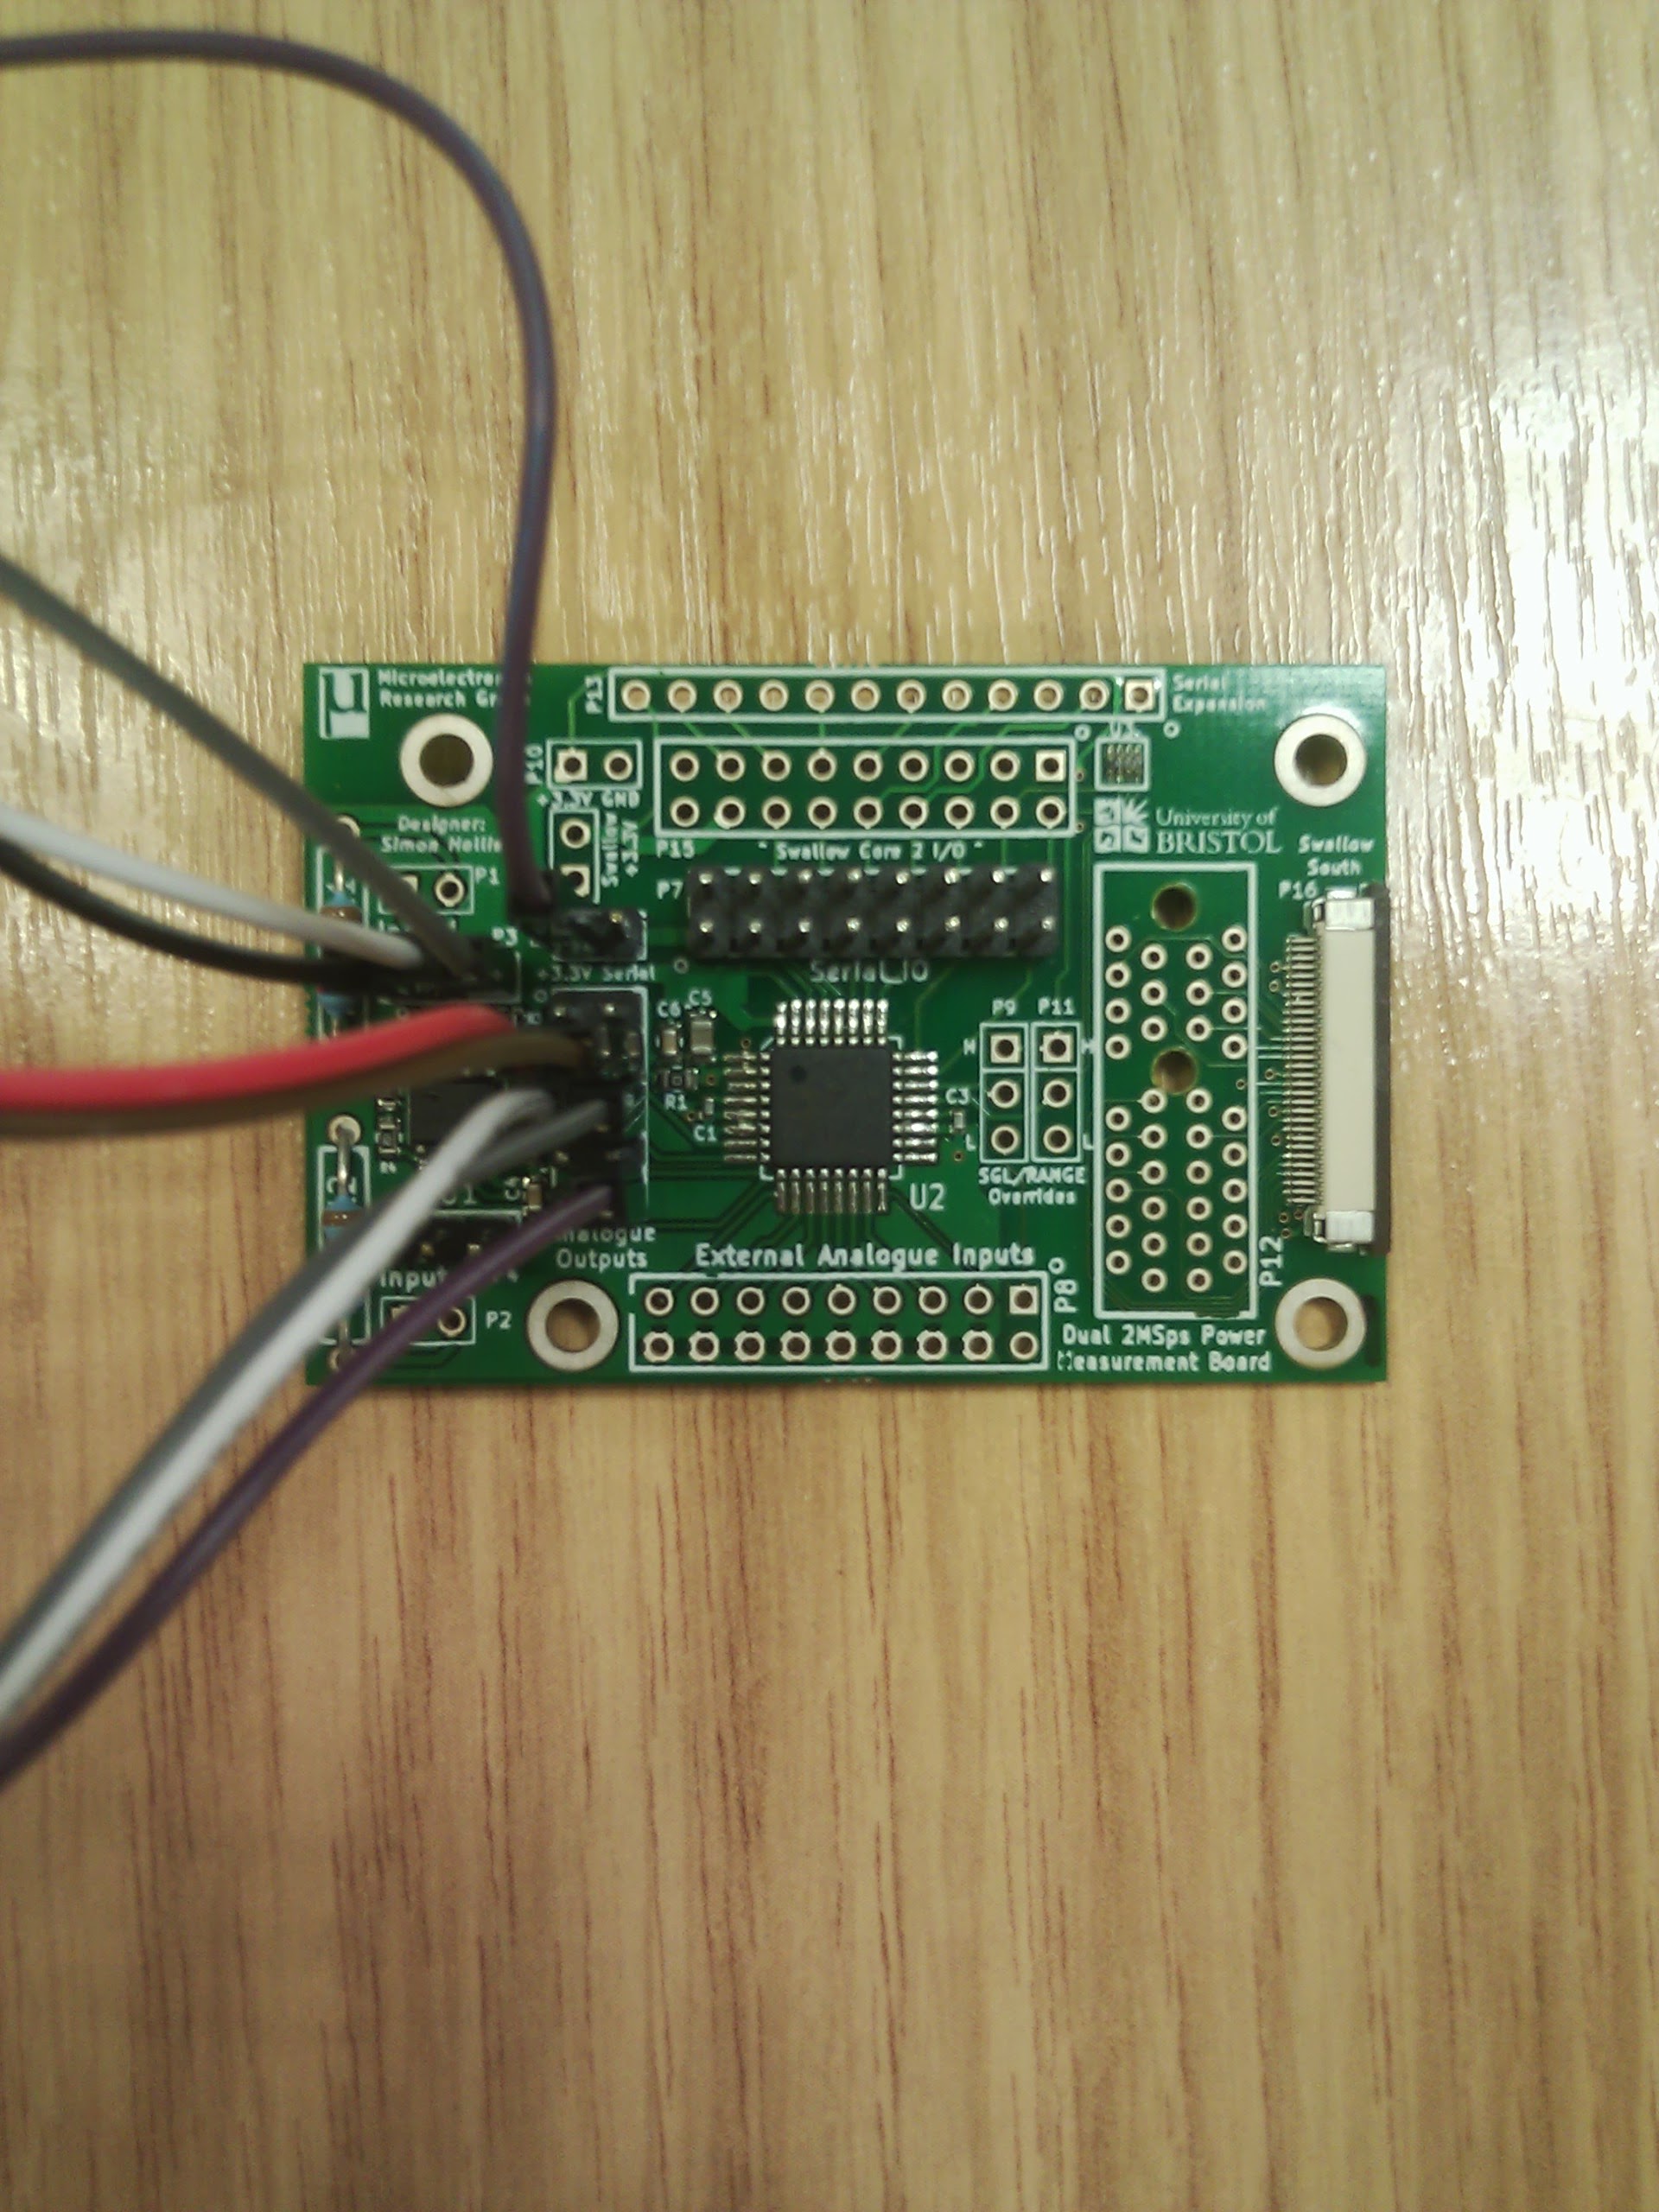
The second board is still in development. This is a shield for the F4 board and is pictured below.

The design files for the shield board are hosted on GitHub and further details will be published to the wiki in due course.
Software
We’re starting off small and using a set of only 10 benchmarks that have been selected from the MiBench and WCET benchmark suites. The first challenge of making these benchmarks useful to us was to get them functioning on the ARM boards. We’re also working to keep benchmarks functioning on a wide range of target platforms.
The benchmarks had been selected in a previous research project by Bristol University called EACOP, and the benchmarks had been used with ARM boards previously. The problem being the ARM cross compiler that was previously used had been deprecated, and we needed to find a new one. There appeared to be two possible options: the ARM-embedded toolchain and compiling from source. We opted to compile from source because the arm-embedded tool chain does not come with Python support pre-built into the GDB binary, which we’d later need to automate the collection of energy readings.
Self-verification
Next we started work on making the programs self-verify. In this case, self-verification means checking the output produced by the program with a stored output, and returning a non-zero return code if the two do not match. Self-verification will become useful later in the project when we need to start checking the correctness of the programs produced by the compiler.
The challenge of this task was to get the benchmarks producing consistent output across all platforms. To make debugging easier, we compared the output on x86 with the output on the ARM boards. Initially, the output from the ARM boards was different to the x86 output and so we started debugging in GDB. To our horror, we’d hit a Heisenbug!
A Heisenbug is “a software bug that seems to disappear or alter its behaviour when one attempts to study it”. In our case, the bug was disappearing when we loaded the benchmarks into GDB. We later discovered that our bug was caused by uninitialised variables. Originally our benchmarks assumed that memory would be zeroed when needed, but this isn’t usually the case. The bug was disappearing because of the way memory allocation works in GDB. Normally the operating system — or in the case of ARM, the program itself — will just give a program memory and if anything is in the memory already, you get that with the memory. With GDB, this allocates the memory and it was zeroing it for us. So after initialising our variables properly, it was onto the next issue!
Some of the benchmarks use randomness, and making randomness consistent is usually quite easy. The standard C libraries have the srand and rand functions. As long as you use srand with the same initial seed number, subsequent calls to rand will always produce the same sequence of numbers with subsequent calls. The ARM boards were still producing different output though! After a bit of digging we discovered that it’s because of slight differences in the standard C library across ARM and x86. ARM uses newlib, instead of libc, and newlib implements rand differently to libc meaning that it produces different numbers to libc, even with the same initial number given to srand. Therefore we had reuse an implementation of rand that had been used previously in some of the benchmarks. After this, all the programs were self verifying!
Automated Framework
The final software part of the puzzle was the automation of testing. For this we’ve produced a small python framework for the loading, running, and measuring of the energy consumption on the ARM boards.
The first task was to get the programs compiling automatically. Each program compiles slightly differently, so we opted to produce makefiles for the benchmarks in order that make would be handling the differences in compilation methods, and the framework wouldn’t have to.
Next was the loading of programs onto the ARM boards. Thankfully, the loading and running of programs are both done in GDB. GDB has three methods of automatic scripting that we could have used. It can take commands via the command line, a GDB script file or via Python scripts. We opted for Python scripts because it would give us much better error handling than the other two methods.
The error handling is important because the framework is designed to run unattended over a period of potentially days so that it would collect enough training data to make the MAGEEC plugin as accurate as possible. Therefore any exceptions need to be caught and dealt with in order that the framework could continue running other tests without human intervention. The GDB script also handles the self-verification of the benchmarks, and makes the GDB exit code depend upon the exit code of the benchmark — making it available to the test framework. The Python framework could now call GDB, tell it to load the Python GDB scripts to put programs onto the ARM boards, and run them.
Lastly, is the all important collection of energy results. As part of the EACOP research project mentioned previously, firmware for the F4 ARM board and accompanying receiver software had been produced, that enable the ARM board to collect the energy readings and to send them over USB to the receiver. The receiver would then convert the results to human readable units, and record them. Therefore the Python framework could just use the results collected by the receiver, and store them appropriately.
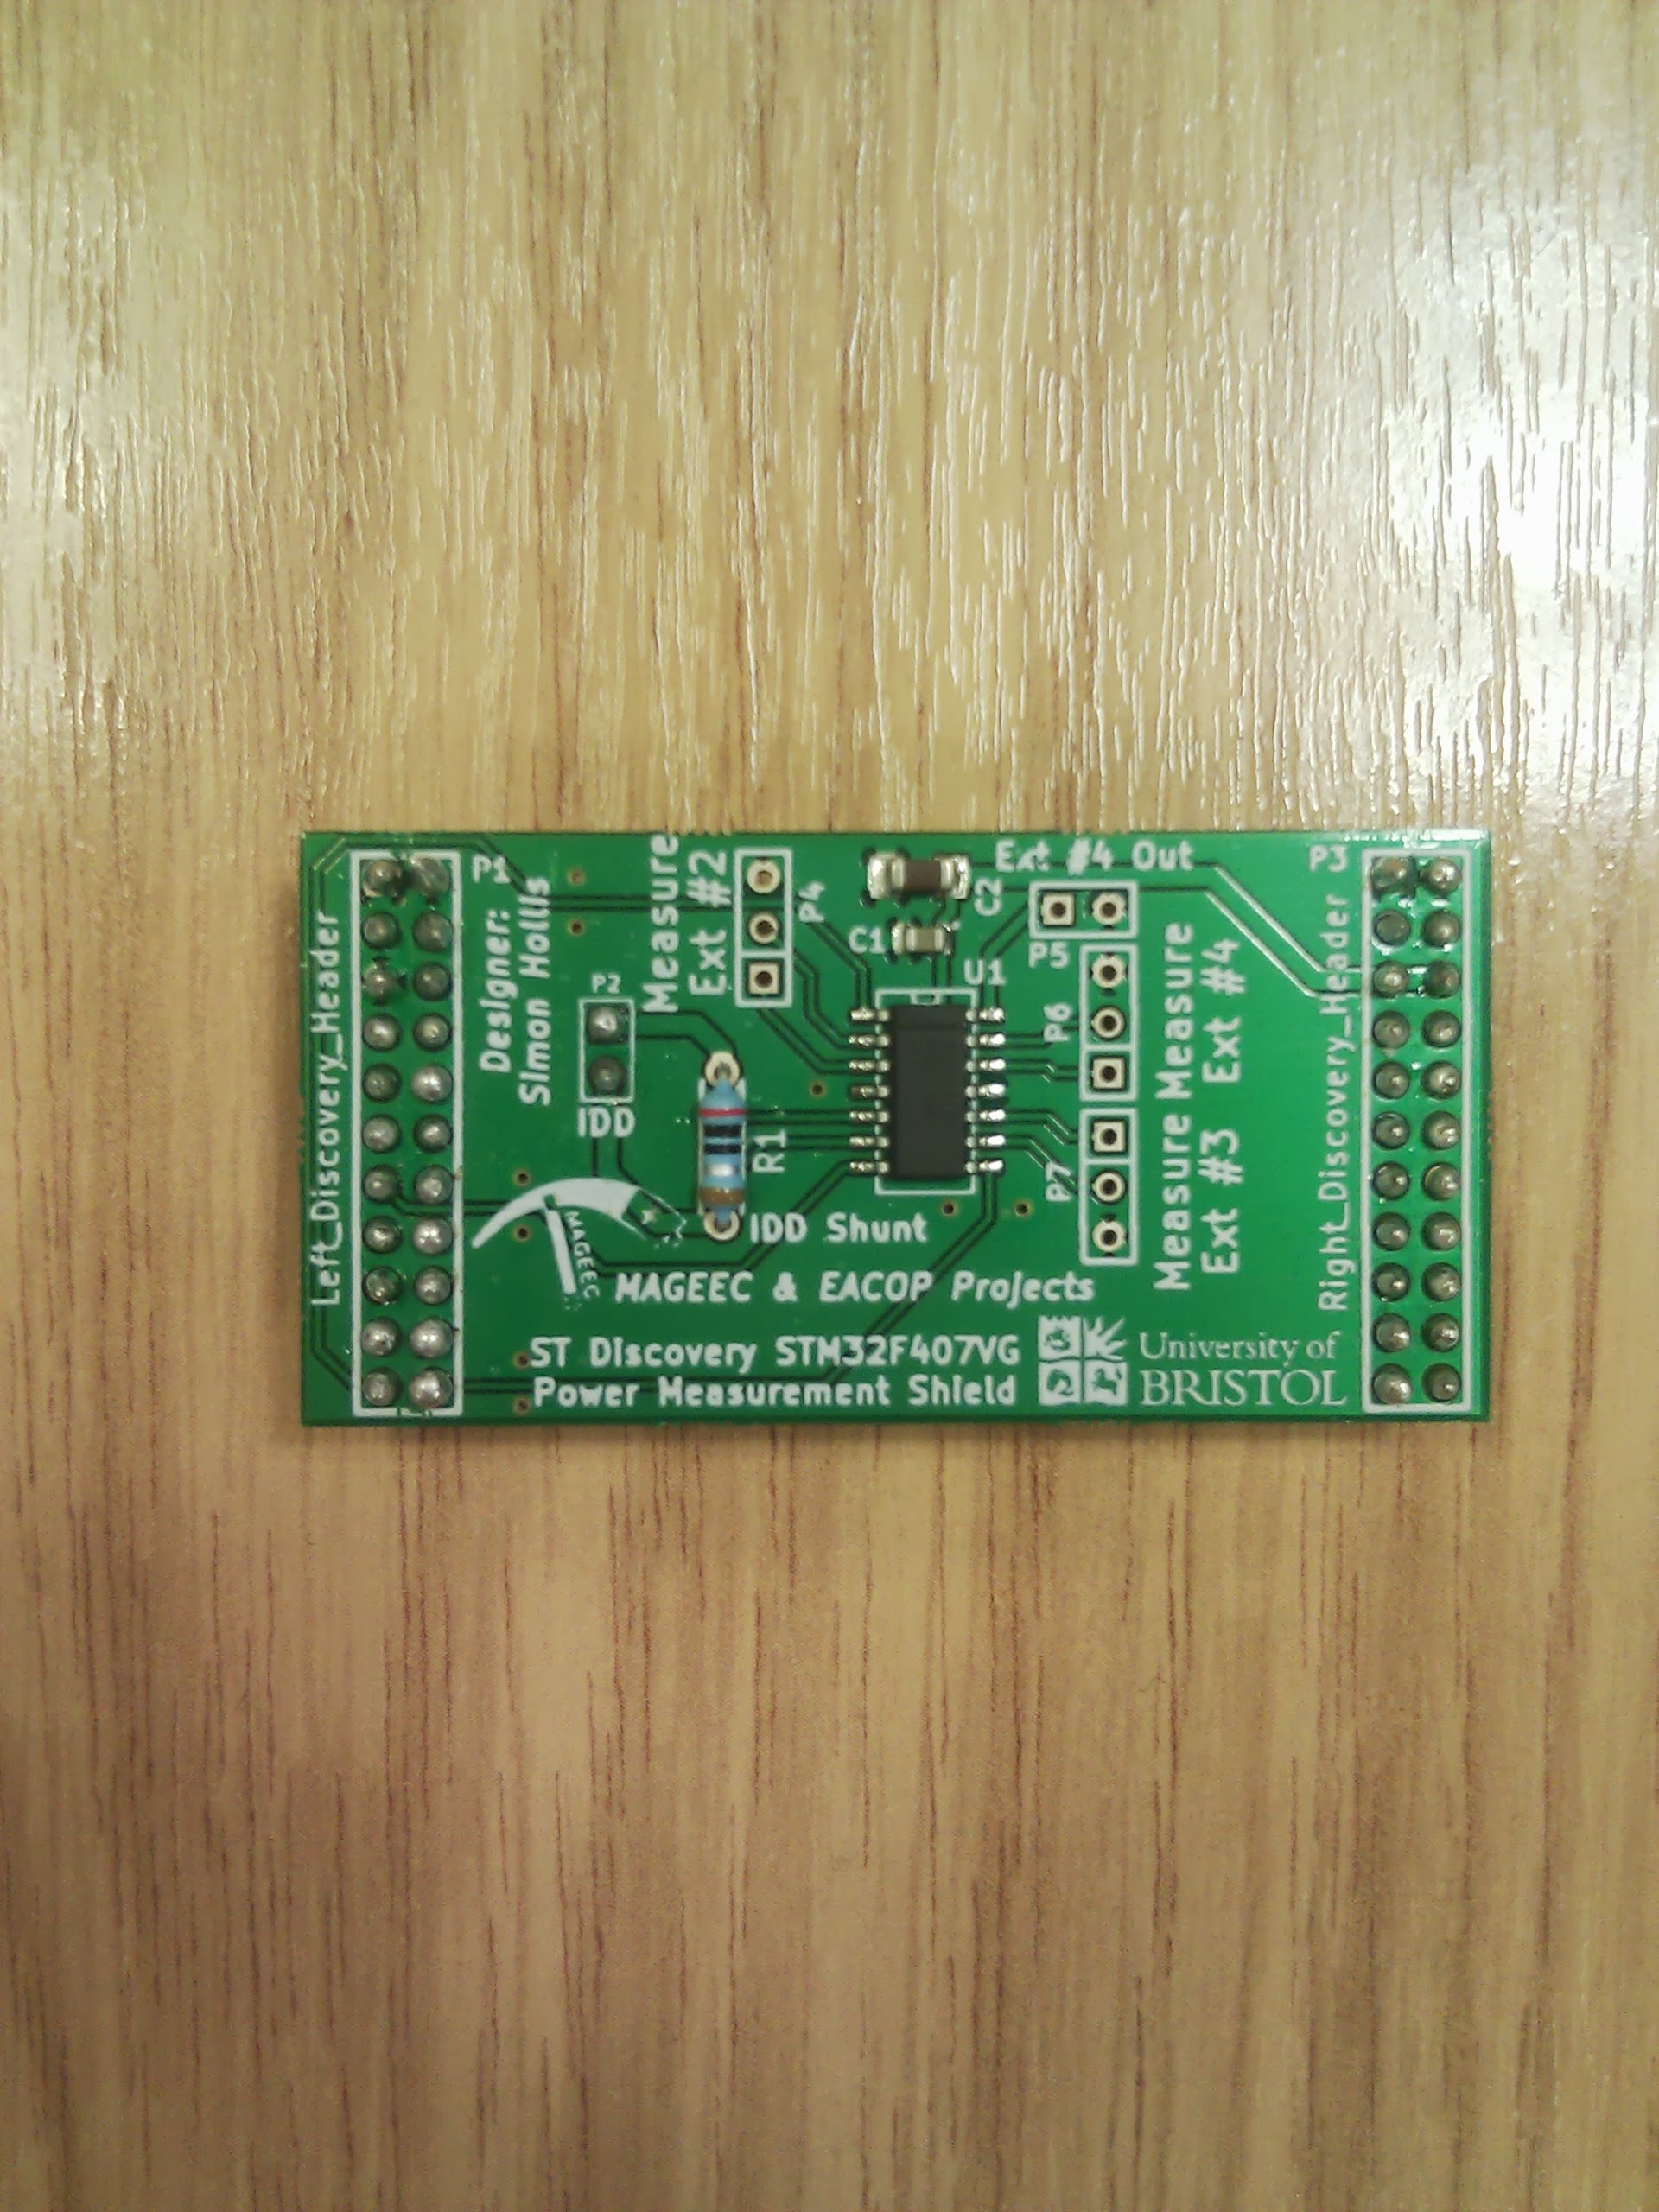
How it all comes together
Overall this infrastructure is capable of collecting a large amount of energy readings for a large amount benchmarks, across a large amount of platforms. At this stage in the project, it means that we can collect large amounts of energy data to feed into the MAGEEC plugin, so as to increase it’s optimization ability. Later in the project it means that we can also test the output of the compiler for both it’s ability to optimize for energy efficiency, the correctness of the programs it produces, as well as making it easy to expand the framework to collect any other data we may need. The way the boards all connect can be seen below.
If you have all the necessary hardware and would like to attempt collecting energy results of your own, take a look at the wiki page which describes how to do so. You can also keep an eye on the MAGEEC GitHub repositories to see how the benchmarks and test framework are evolving.


")


